

I receive a lot of questions like this — basically how to optimally outline sales affects vs changes with partners/products in our store.
On Sept 12, 2024, Partner X provided us a commission on the lowest category seats (cat E and K) for Product Y. Prior to this, we did not sell this category because they would not provide us a commission on these seats.
I advised earlier this year to Partner X that providing the additional lower priced inventory would increase our ability to showcase the lowest rate, thus bringing shoppers to their page and increasing overall conversion, including the higher-priced categories. Partner X says they didn’t see the increase in production at the higher-priced categories and is dragging their feet providing us commission in 2026 for these seats. Consequently, we are not selling them at this time.
So, the question essentially is: What can we provide Partner X that will support our argument that the addition of cat E and K ticket types (with commission) has allowed us to increase our Product Y bookings post Sept 20?
Start Simple
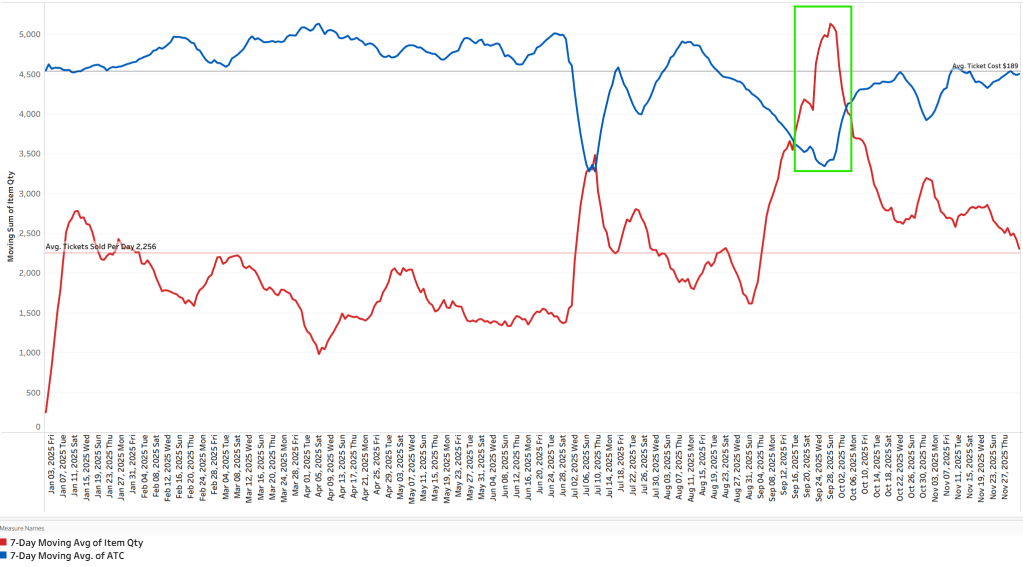
Looking at the 7 Day Moving Avg of Tickets Sold [Red] vs the Avg. Ticket Cost [Blue], we see a direct cause and affect of introducing the lower priced ticket types. We saw sales spike immediately. More users were buying overall tickets in all ticket types. The supplier was also making more money on average. I included horizonal YTD average lines to also highlight this.
What is happening though after this time span? Ticket sales are falling — is that what the partner is referring to as to why they aren’t seeing enough sales?
Build a Buy-Up Query with Average Sales Per Day Over Different Time Frames
SELECT
    r.time_period_label,
    r.price_band_rank,
    r.days_in_period,
    r.orders_at_rank,
    r.units_at_rank,
    r.gross_revenue_at_rank,
    r.cost_at_rank,
    r.net_revenue_at_rank,

    -- Concatenated “price band” names that roll into this rank
    r.price_band_names_at_rank,

    -- Share of orders within the time period (decimal 0–1)
    ROUND(
        CAST(r.orders_at_rank AS float)
        / NULLIF(SUM(r.orders_at_rank) OVER (PARTITION BY r.time_period_label), 0),
        4
    ) AS pct_of_orders_in_period,

    -- Average unit price at this rank
    ROUND(
        r.revenue_at_rank / NULLIF(r.units_at_rank, 0),
        2
    ) AS avg_unit_price_at_rank,

    -- Units sold per day at this rank & period
    ROUND(
        CAST(r.units_at_rank AS float) / NULLIF(r.days_in_period, 0),
        2
    ) AS units_per_day_at_rank,

    -- Orders per day at this rank & period
    ROUND(
        CAST(r.orders_at_rank AS float) / NULLIF(r.days_in_period, 0),
        2
    ) AS orders_per_day_at_rank,

    -- Gross revenue per day at this rank
    ROUND(
        CAST(r.gross_revenue_at_rank AS float) / NULLIF(r.days_in_period, 0),
        2
    ) AS gross_revenue_per_day_at_rank,

    -- Cost per day at this rank
    ROUND(
        CAST(r.cost_at_rank AS float) / NULLIF(r.days_in_period, 0),
        2
    ) AS cost_per_day_at_rank,

    -- Net revenue per day at this rank
    ROUND(
        CAST(r.net_revenue_at_rank AS float) / NULLIF(r.days_in_period, 0),
        2
    ) AS net_revenue_per_day_at_rank

FROM (
    -- Aggregate metrics by time period and price rank
    SELECT
        time_period_label,
        days_in_period,
        price_band_rank,
        SUM(total_orders)      AS orders_at_rank,
        SUM(total_revenue)     AS revenue_at_rank,
        SUM(total_gross)       AS gross_revenue_at_rank,
        SUM(total_cost)        AS cost_at_rank,
        SUM(total_net_revenue) AS net_revenue_at_rank,
        SUM(total_units)       AS units_at_rank,

        -- One concatenated list of price bands per (period, rank)
        STRING_AGG(price_band_name, ', ') AS price_band_names_at_rank

    FROM (
        -- Rank price bands by average price within each time period
        SELECT
            ap.time_period_label,
            ap.start_date,
            ap.end_date,
            ap.days_in_period,
            ap.product_name,
            ap.price_band_name,
            ap.total_units,
            ap.total_revenue,
            ap.total_gross,
            ap.total_net_revenue,
            ap.total_cost,
            ap.avg_unit_price,
            ap.total_orders,
            RANK() OVER (
                PARTITION BY ap.time_period_label, ap.product_name
                ORDER BY ap.avg_unit_price ASC
            ) AS price_band_rank
        FROM (
            -- Aggregate raw transactions into product × price band × time period
            SELECT
                p.time_period_label,
                p.start_date,
                p.end_date,
                DATEDIFF(DAY, p.start_date, p.end_date) + 1 AS days_in_period,
                f.product_name,
                f.price_band_name,
                SUM(f.unit_quantity)     AS total_units,
                SUM(f.revenue_amount)    AS total_revenue,
                SUM(f.gross_revenue)     AS total_gross,
                SUM(f.net_revenue)       AS total_net_revenue,
                SUM(f.cost_amount)       AS total_cost,
                SUM(f.revenue_amount) / NULLIF(SUM(f.unit_quantity), 0) AS avg_unit_price,
                COUNT(DISTINCT f.order_id) AS total_orders
            FROM fact_sales f
            JOIN (
                -- Define the three comparison periods
                SELECT 'Period 1' AS time_period_label,
                       CAST('2024-01-01' AS date) AS start_date,
                       CAST('2024-03-31' AS date) AS end_date
                UNION ALL
                SELECT 'Period 2',
                       CAST('2024-04-01' AS date),
                       CAST('2024-06-30' AS date)
                UNION ALL
                SELECT 'Period 3',
                       CAST('2024-07-01' AS date),
                       CAST('2024-09-30' AS date)
            ) AS p
              ON f.order_date >= p.start_date
             AND f.order_date <= p.end_date
            WHERE
                f.order_status = 'COMPLETED'
                AND f.product_type = 'PRIMARY'
                AND f.product_name IN ('Flagship Product')
                -- Optional: exclude a short-lived outlier price band
                -- AND f.price_band_name <> 'Experimental Tier'
            GROUP BY
                p.time_period_label,
                p.start_date,
                p.end_date,
                f.product_name,
                f.price_band_name
        ) AS ap
    ) AS rp
    GROUP BY
        time_period_label,
        days_in_period,
        price_band_rank
) AS r
ORDER BY
    r.time_period_label,
    r.price_band_rank;
This query ranks ticket types by price over the specified time frames and allows you to compare 3 different time frames at once — this lets us look at the Sept 12 infection period.
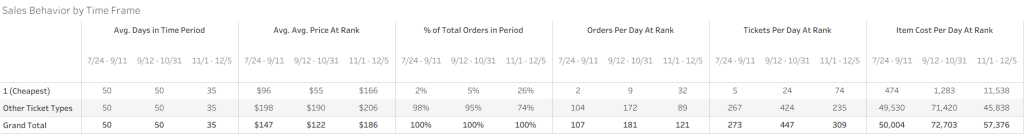
We see that the Average Price goes from $96 before the introduction of cheap ticket types, to $55, then up to $166. Orders, tickets, and item cost per day all follow the same pattern. The partner was making more when we had the ability to sell lower priced ticket types. When the average ticket price increases again, or when we didn’t have all ticket types to sell from, the partner starting making less money. The more choices we give the customer (to an extent), especially the ability to choose the worst seat in the theater (if they desire) the better all other ticket types look and the more we sell.


Leave a comment