

This project showcases a mid level ask from Product Team Director
Work up some projections for 3 fee test scenarios:
Objective
Test three alternative fee structures each with current lead-in SKUs set at $0 fees to maintain profitability while improving market share:
- Round 1: Compressed tiers
- Round 2: Hybrid Flat + Tier
- Round 3: No fees on anything
Metrics
Primary:
- Net Revenue
- GOV
- Transaction Volume
- Ticket Volume
- Take Rate
Duration
- Minimum 2–3 weeks per round
Rounds
Round 1: Compressed Tiers
$40–49.99 → 25%
$50–59.99 → 22%
$60–79.99 → 18%
$80–99.99 → 14%
$100+ → 13.5%
Round 2: Hybrid Flat + Tier
Base: 1% + surcharge
$40–49.99 → +2%
$50–59.99 → +2.5%
$60–79.99 → +3%
$80–99.99 → +3.5%
$100+ → +4%
Round 3:
Pure volume play — All skus 0% fee
Assumptions:
Work with the following assumptions:
- None of the options would see traffic degradation from Control today as they all have $0 lead-in pricing.
- Compressed tier should see a modest improvement in buy up % and maximize revenue for those percentages.
- Hybrid tier would more aggressively improve buy up% but less profitably.
What I’d like you to work on (based on current sales volumes and analysis of current test performance:
- What do the metrics listed above look like for each variant based on conversion increases of 3%, 5%, 10% and 20% vs. today’s control.
- What conversion increase would $0 fees have to hit to break even on net revenue? What would that look like for volume (orders, tickets)?
_______________________________________________________________________________________________
_______________________________________________________________________________________________
I could attack this problem in Tableau or in Excel. Preferred method of the General Manager is Excel, so that is what I went with.
First, I looked at the current Fee Test that was running so I have the current control performance. Looking at this performance by Price Bucket and by Sku Level, I could begin looking at the other scenarios.
The good thing was that when I build a model in Excel, if the parameters are built correctly, only the fee inputs need changed to look at difference scenarios. These are all of the inputs I needed — (1) increase or decrease in sales/conversion (2) % Fee Levels by Control/Variant by Price Bucket
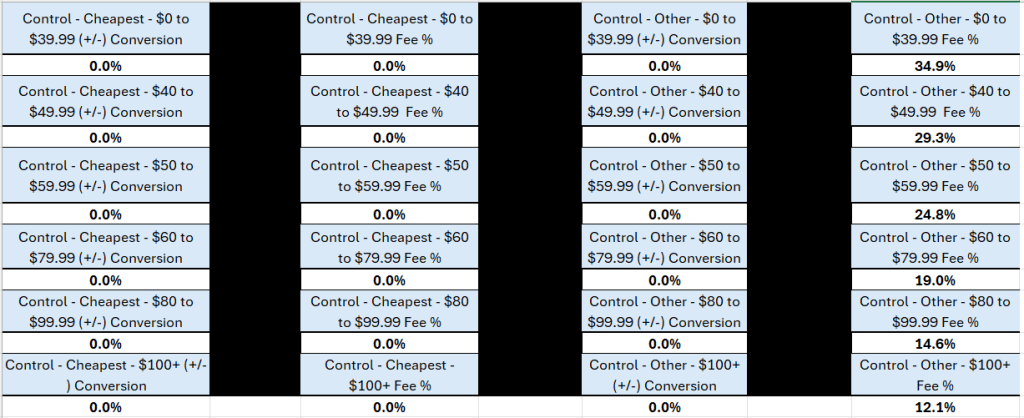
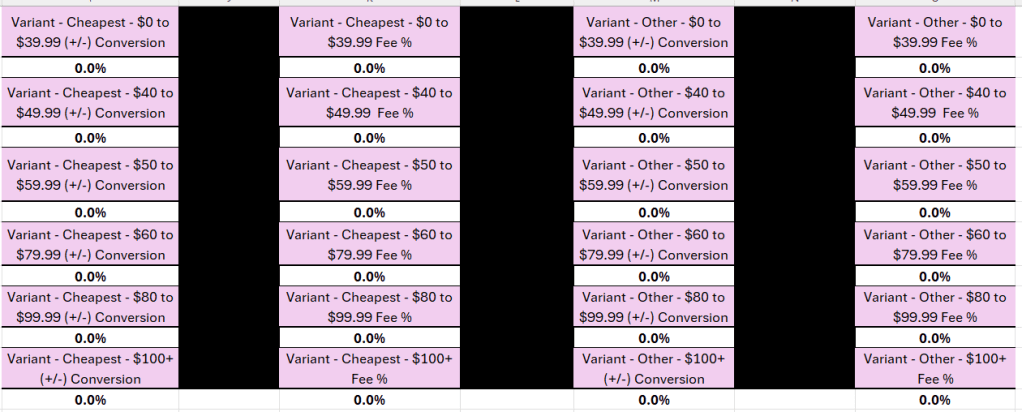
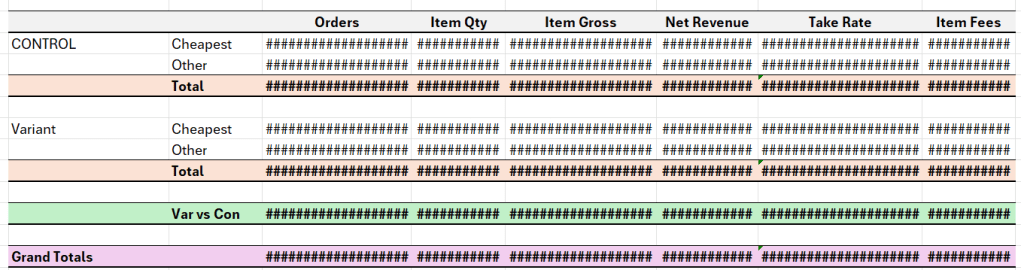
Changing these inputs changed all data by price level and by sku levels. This allowed for ease of seeing how different fee levels and increases or decreases in conversion would affect our major KPIs. This was the summary output, but we could look at price level if needed.


Leave a comment