
The ability to look at the pace of sales in the future compared to how we were pacing in sales as of last year is very important. We want to be able to know that (for example) as of today, November 1st 2025, how much in revenue have we sold for December 2025, and how does this compare to revenue as of November 2nd 2024 for December 2024. Always accounting for same day of week. Roll ups, however, are by calendar month for my use-case.
Furthermore, the user needs to be able to look at all sales and sales within the last ‘N’ days. If a partner runs a deal, they would be able to see they are pacing better the last 7 days vs the last 90 days (for example).
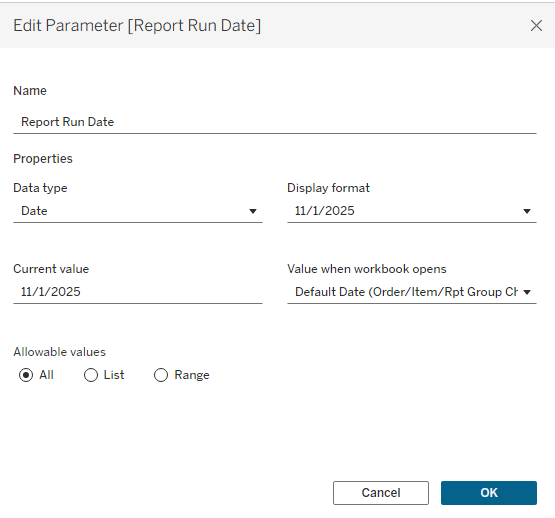
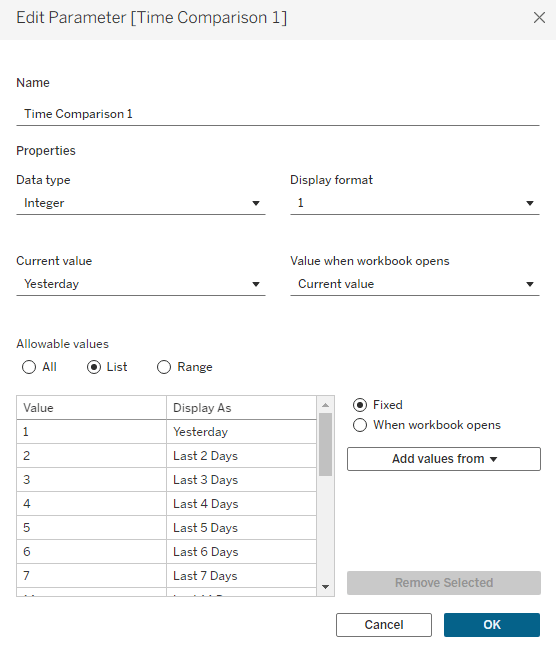
Step (1) Create Parameters for Report Run Date and How Far Back You Want To Go For Sales
Adding in these parameters gives you the ability to slice the data and view it in as many ways as you want, but whatever point in time. Sometimes the end users need to know what pace looked like as of 3 months ago, vs 1 month ago, vs now.
Be sure to add in whatever number of days you want to look back for sales, I give all possible outcomes for the end user.
Step (2) Create the Current Year Measure
CASE [Sales Metric] WHEN “Item Qty”
THEN zn(sum(IF DATEDIFF(‘year’,[Item Date],[Report Run Date]) = 0 AND DATE([Transaction Date])< [Report Run Date] and DATE([Transaction Date])>= [Report Run Date] – [Time Comparison 1] THEN [Tickets] END))
WHEN “# Orders”
THEN zn(COUNTD(IF DATEDIFF(‘year’,[Item Date],[Report Run Date]) = 0 AND DATE([Transaction Date])< [Report Run Date] and DATE([Transaction Date])>= [Report Run Date] – [Time Comparison 1] THEN [Order Id] END)))
END
Step (3) Create the Prior Year Measure
CASE [Sales Metric] WHEN “Item Qty”
THEN zn(sum(IF DATEDIFF(‘year’,[Item Date],[Report Run Date]) = 1 AND DATE([Transaction Date])< [Report Run Date]-365 and DATE([Transaction Date])>= [Report Run Date]-365 – [Time Comparison 1] THEN [Tickets] END))
WHEN “# Orders”
THEN zn(COUNTD(IF DATEDIFF(‘year’,[Item Date],[Report Run Date]) = 1 AND DATE([Transaction Date])<= [Report Run Date]-365 and DATE([Transaction Date])> [Report Run Date]-365 – [Time Comparison 1] THEN [Order Id] END))
END
Step (4) Create the Next Year Measure
Notice that Date Diff for Year is -1 which indicates next year.
CASE [Sales Metric] WHEN “Item Qty”
THEN zn(sum(IF DATEDIFF(‘year’,[Item Date],[Report Run Date]) = -1 AND DATE([Transaction Date])< [Report Run Date] and DATE([Transaction Date])>= [Report Run Date] – [Time Comparison 1] THEN [Tickets] END))
WHEN “# Orders”
THEN zn(COUNTD(IF DATEDIFF(‘year’,[Item Date],[Report Run Date]) = -1 AND DATE([Transaction Date])< [Report Run Date] and DATE([Transaction Date])>= [Report Run Date] – [Time Comparison 1] THEN [Order Id] END))
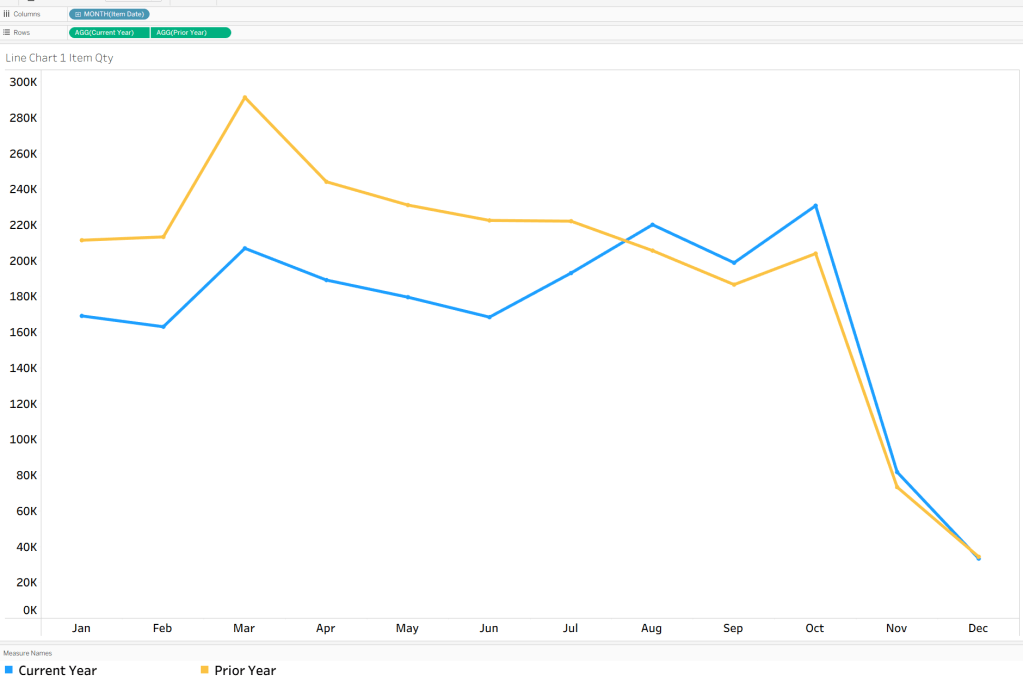
Step (5) Chart
Be sure to chart by Event Date or Consumption Date, even though your calculations looks at sales by when they occurred. For this current product type and product, we see that it was pacing down YoY, but in August 2025 pace of sales increased. This report is looked at on a daily base by users for specific use cases to check performance — very useful and Tableau is great at letting people dynamically change filters. Thousands of reports in one!


Leave a comment