

For years, we evaluated A/B tests in the Universal Analytics (UA) or Google Analytics (GA) or Google Analytics 4 (GA4). When we migrated our data into Snowflake, the ability to query the data became easier (at least for me). The process below saved hours of work within the GA4 interface looking at tests. Only the top portion needs altered based on the test and the report runs the same for all tests.
The Data Scientists and Project Manager team asked me to create a Tableau Dashboard to be able to look at the results of the A/B Tests. Data would need to be broken out by Control and Variant transactions, by Price Buckets, by Booking Window, as well as the ability to see how the lowest price skus were behaving vs all other skus. We needed this part due to price testing. All-in-pricing changed how we approached a lot of decisions in 2025.
As you can tell, it’s a lot of things to account for. But using the Google Analytics Event Table with Experiment IDs that get tracked on the website, as well as 2 other Sales Tables in Snowflake, it could be done. Note that tables and names are all aliased.
-- ===========================================================
-- Example: Session-Anchored A/B Attribution for Purchases
-- Experiment: SR_Show_General (Control vs Variant)
-- NOTE: Replace placeholder schemas/columns to fit your warehouse.
-- ===========================================================

WITH params AS (
  SELECT
    DATE '2025-10-16'              AS start_date,          -- demo window start
    DATEADD(DAY, -1, CURRENT_DATE) AS end_date_excl_today
),

/* -----------------------------------------------------------
   1) ANCHOR EVENTS (per session): page path + matching experiment tag
   Take MIN(event_time) per (user, session) where BOTH are true.
   - 'page_path' should match your routed page
   - 'experiment_groups' is a string/array with assigned variants
------------------------------------------------------------ */
control_anchor AS (
  SELECT
    e.user_id,
    e.session_id,
    MIN(e.event_time) AS anchor_ts
  FROM analytics.events e
  JOIN params p
    ON e.event_date BETWEEN p.start_date AND p.end_date_excl_today
  WHERE e.page_path ILIKE '%/search/results%'
    AND (
      -- experiment_groups can be JSON/array/string. Example uses string contains.
      (e.experiment_groups || ',') LIKE '%EXP_A%'
    )
  GROUP BY e.user_id, e.session_id
),
variant_anchor AS (
  SELECT
    e.user_id,
    e.session_id,
    MIN(e.event_time) AS anchor_ts
  FROM analytics.events e
  JOIN params p
    ON e.event_date BETWEEN p.start_date AND p.end_date_excl_today
  WHERE e.page_path ILIKE '%/search/results%'
    AND (
      (e.experiment_groups || ',') LIKE '%EXP_B%'
    )
  GROUP BY e.user_id, e.session_id
),

/* -----------------------------------------------------------
   2) PURCHASE TRANSACTION IDS after anchor_ts within SAME session
   - Assumes purchase events include a transaction_id
------------------------------------------------------------ */
control_txn AS (
  SELECT DISTINCT
    e.transaction_id
  FROM analytics.events e
  JOIN params p
    ON e.event_date BETWEEN p.start_date AND p.end_date_excl_today
  JOIN control_anchor a
    ON a.user_id    = e.user_id
   AND a.session_id = e.session_id
   AND e.event_time >= a.anchor_ts
  WHERE e.event_name = 'purchase'
    AND e.transaction_id IS NOT NULL
),
variant_txn AS (
  SELECT DISTINCT
    e.transaction_id
  FROM analytics.events e
  JOIN params p
    ON e.event_date BETWEEN p.start_date AND p.end_date_excl_today
  JOIN variant_anchor a
    ON a.user_id    = e.user_id
   AND a.session_id = e.session_id
   AND e.event_time >= a.anchor_ts
  WHERE e.event_name = 'purchase'
    AND e.transaction_id IS NOT NULL
),

/* -----------------------------------------------------------
   3) Tag transaction ids by experiment group (for downstream joins)
------------------------------------------------------------ */
experiment_txn AS (
  SELECT 'SR_Show_General' AS experiment, 'Control' AS group_type, transaction_id
  FROM control_txn
  UNION ALL
  SELECT 'SR_Show_General' AS experiment, 'Variant' AS group_type, transaction_id
  FROM variant_txn
),

/* -----------------------------------------------------------
   4) Order Lines at a stable SKU grain
   - Replace with your commerce layer tables/joins
------------------------------------------------------------ */
order_lines AS (
  SELECT
    o.channel,
    o.order_id,
    o.order_ts::DATE                  AS order_date,
    o.order_reference                 AS order_reference,      -- join key to events.transaction_id
    CAST(oi.item_date AS DATE)        AS item_date,            -- event/item date
    oi.product_name,
    oi.sku                            AS item_sku,
    SUM(oi.qty)                       AS item_qty,
    SUM(oi.gross_amount)              AS item_gross,
    SUM(oi.unit_price)                AS item_price,
    SUM(oi.fee_amount)                AS item_fee,
    SUM(oi.tax_amount)                AS item_tax,
    SUM(oi.unit_cost)                 AS item_cost,
    SUM(oi.gross_amount) - SUM(oi.tax_amount) - SUM(oi.unit_cost) AS net_revenue
  FROM commerce.orders o
  JOIN commerce.order_items oi
    ON  o.order_id = oi.order_id
  WHERE o.order_ts::DATE > DATE '2023-12-31'
    AND o.channel = 'WEB'
    AND oi.product_type = 'TICKET'
  GROUP BY
    o.channel, o.order_id, o.order_ts, o.order_reference,
    oi.product_name, oi.sku, oi.item_date
),

/* -----------------------------------------------------------
   5) Attach experiment group to order lines via transaction id
------------------------------------------------------------ */
base AS (
  SELECT
    e.experiment,
    e.group_type,
    ol.channel,
    ol.order_id,
    ol.order_date,
    CAST(ol.order_date AS DATE) AS transaction_date,   -- purchase date
    ol.item_date,                                       -- event date
    ol.order_reference,
    ol.product_name,
    ol.item_sku,
    ol.item_qty,
    ol.item_gross,
    ol.item_price,
    ol.item_fee,
    ol.item_tax,
    ol.item_cost,
    ol.net_revenue
  FROM experiment_txn e
  JOIN order_lines ol
    ON e.transaction_id::STRING = ol.order_reference::STRING
),

/* -----------------------------------------------------------
   6) Label time periods (example: YoY comparison)
   - Adjust anchors for your narrative
------------------------------------------------------------ */
labeled AS (
  SELECT
    CASE
      WHEN (order_date >= DATE '2024-07-18'
            AND order_date < DATEADD(week, -52, CAST(CURRENT_DATE AS DATE)))
        THEN 'Last Year'
      WHEN (order_date >= DATE '2025-07-17'
            AND order_date < CAST(CURRENT_DATE AS DATE))
        THEN 'This Year'
    END AS period,
    experiment,
    group_type,
    channel,
    product_name,
    item_sku,
    order_id,
    transaction_date,                                 -- purchase date
    item_date,                                        -- event date
    DATEDIFF(day, transaction_date, item_date) AS booking_window_days,
    item_qty,
    item_gross,
    item_price,
    item_fee,
    item_tax,
    item_cost,
    net_revenue
  FROM base
  WHERE
    (order_date >= DATE '2024-07-18' AND order_date < DATEADD(week, -52, CAST(CURRENT_DATE AS DATE)))
    OR
    (order_date >= DATE '2025-07-17' AND order_date < CAST(CURRENT_DATE AS DATE))
),

/* Keep rows with both dates present (charting/BI-friendly) */
labeled_nonnull AS (
  SELECT *
  FROM labeled
  WHERE transaction_date IS NOT NULL
    AND item_date IS NOT NULL
),

/* -----------------------------------------------------------
   7) Aggregate to daily grain, preserve booking_window
------------------------------------------------------------ */
agg AS (
  SELECT
    period,
    experiment,
    group_type,
    channel,
    product_name,
    item_sku,
    transaction_date,
    item_date,
    booking_window_days,
    COUNT(DISTINCT order_id)           AS num_orders,
    SUM(item_price)                    AS total_item_price,
    SUM(item_qty)                      AS total_item_qty,
    SUM(item_gross)                    AS total_item_gross,
    SUM(item_fee)                      AS total_item_fee,
    SUM(item_tax)                      AS total_item_tax,
    SUM(net_revenue)                   AS total_net_revenue,
    SUM(item_cost)                     AS total_item_cost,
    SUM(item_price - item_cost)        AS total_margin,
    CASE WHEN SUM(item_qty) > 0
         THEN SUM(item_price) * 1.0 / SUM(item_qty)
    END                                AS avg_ticket_price
  FROM labeled_nonnull
  GROUP BY
    period, experiment, group_type, channel, product_name, item_sku,
    transaction_date, item_date, booking_window_days
),

/* -----------------------------------------------------------
   8) Period-level qty-weighted ATP by SKU
------------------------------------------------------------ */
sku_period_avg AS (
  SELECT
    period,
    experiment,
    group_type,
    channel,
    product_name,
    item_sku,
    CASE WHEN SUM(total_item_qty) > 0
         THEN SUM(total_item_price) * 1.0 / SUM(total_item_qty)
    END AS period_avg_atp,
    SUM(total_item_qty)   AS period_qty,
    SUM(total_item_price) AS period_price
  FROM agg
  GROUP BY
    period, experiment, group_type, channel, product_name, item_sku
),

/* 9) Rank SKUs by period ATP (lowest = 1) */
sku_period_rank AS (
  SELECT
    spa.*,
    DENSE_RANK() OVER (
      PARTITION BY period, experiment, group_type, channel, product_name
      ORDER BY period_avg_atp ASC
    ) AS period_price_rank
  FROM sku_period_avg spa
),

/* 10) Attach stable period rank back to daily rows */
ranked AS (
  SELECT
    a.*,
    r.period_avg_atp,
    r.period_price_rank
  FROM agg a
  LEFT JOIN sku_period_rank r
    ON  r.period       = a.period
    AND r.experiment   = a.experiment
    AND r.group_type   = a.group_type
    AND r.channel      = a.channel
    AND r.product_name = a.product_name
    AND r.item_sku     = a.item_sku
)

SELECT
  period,
  experiment,
  group_type,
  channel,
  product_name,
  item_sku,
  transaction_date,
  item_date,
  booking_window_days,
  avg_ticket_price,             -- daily/txn-grain ATP
  period_avg_atp,               -- stable ATP over the period
  period_price_rank,            -- stable rank (1 = lowest ATP)
  num_orders,
  total_item_price,
  total_item_qty,
  NULL AS total_order_fees,     -- optional placeholder
  total_item_gross,
  total_item_fee,
  total_item_tax,
  total_net_revenue,
  total_item_cost,
  total_margin
FROM ranked;
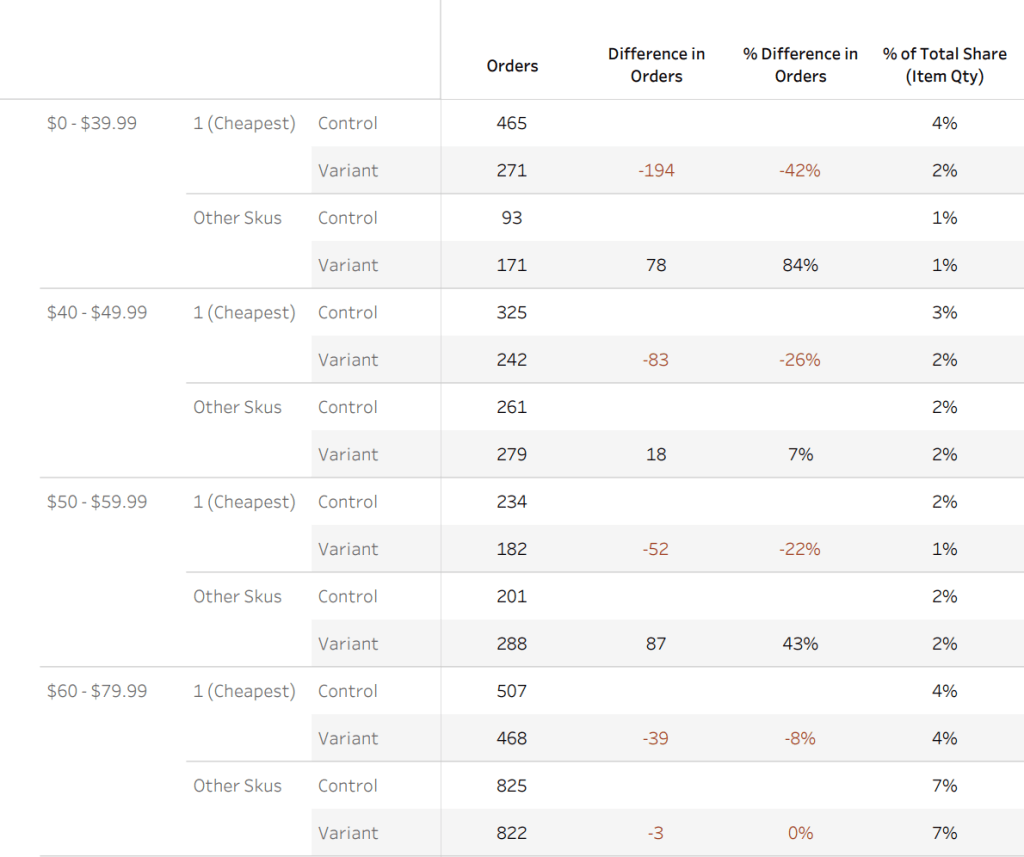
The report goes out in PDF form, but it also can be built with dynamic filters which I use with the data scientists. We can look at any breakdown on the fly.
In one test we found that behavior drastically changed by day of week, this allows us to tweak the test based on day of week to maximize revenue.


Leave a comment