

Maybe this is more common than I think, but I’ve mentioned this website to a couple data folks like myself and it’s always highly welcomed as it pertains to “free data”.
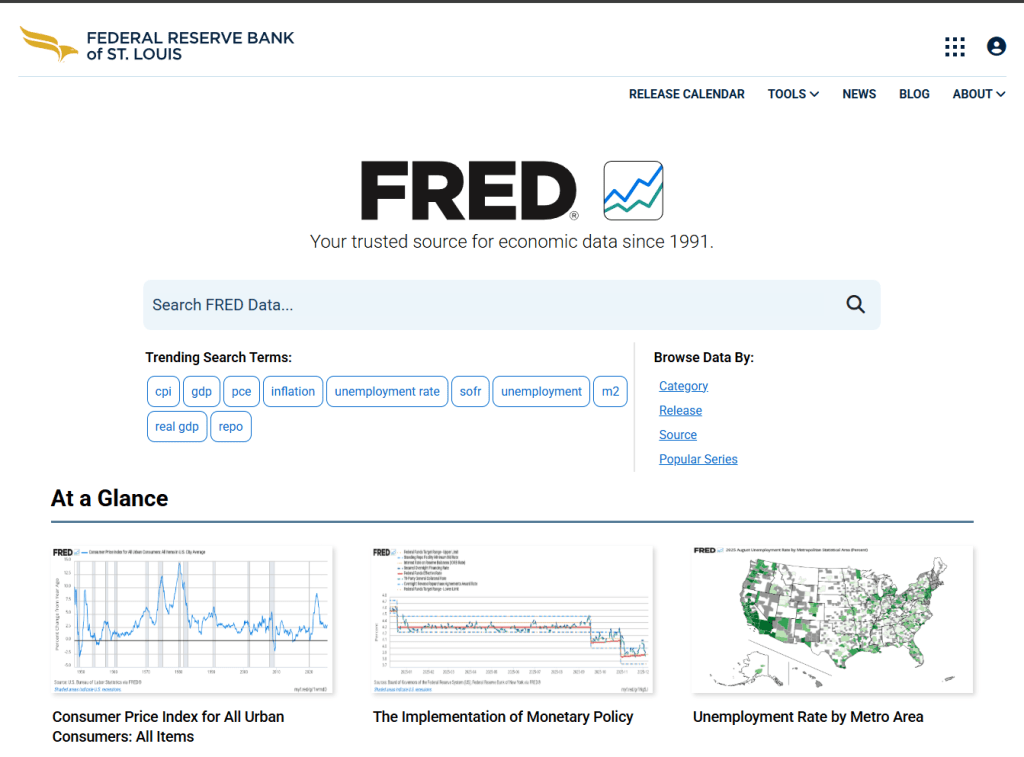
What is FRED?
Simply, it’s the Federal Reserve Bank of St. Louis’ Website: online economic-data database
As of now, it offers hundreds of thousands (800,000+) data series from many national, international, public and private sources.
What kinds of data are on FRED?
FRED covers a very broad spectrum of economic and financial topics. Some major categories include:
- Inflation / price indexes (Consumer Price Index, Producer Price Index, etc.)
- Employment and labor data (unemployment rates, job openings, etc.)
- Gross Domestic Product (GDP), national accounts, economic growth metrics
- Interest rates, monetary aggregates, banking and credit data, financial-market indicators
- Housing, trade, regional data, housing-market indexes — even data at the state or metro-area level
- International data (for countries beyond the U.S.), global economic indicators, exchange rates, and more.
What you can do on FRED (Tools & Features)
FRED isn’t just a data repository — it’s designed for exploration and analysis:
- Interactive graphs — you can quickly chart any time series, zoom, change date ranges, etc.
- Data downloads — export data in CSV, Excel or other formats for further analysis.
- API access — for developers or data scientists, FRED provides an API so you can pull data directly into scripts or dashboards (Python, R, etc.).
- Data transformations — you can adjust units (levels vs percent change, seasonally adjusted vs not, etc.) to suit your analysis or storytelling
- Wide source coverage — FRED aggregates data from dozens of sources (government agencies, private data providers, international orgs), so you can often find both official “macro” data and more niche data series in one place.
Why FRED matters / Who uses it
- It’s one of the most widely used economic-data websites in the world (by researchers, journalists, analysts, policy watchers, students).
- Because it combines data from many sources (government, private, international), it lets you compare different kinds of indicators side-by-side — e.g. inflation vs unemployment vs interest rates vs housing — all in one place.
- It’s free and openly accessible, which democratizes data: anyone — from hobbyist data bloggers to professional economists — can pull real macroeconomic data quickly.
- For people like you (data-blog or analytics-site authors) it’s great: you can find interesting real-world data to build stories, charts and insights around — without needing your own data pipeline.
Summary — In Simple Terms
FRED is like a giant, free, super-flexible economic data toolbox maintained by the St. Louis Fed. It gives you access to tens/hundreds of thousands of historical and current economic data series (from inflation and employment to housing and interest rates), plus easy ways to chart, download, or pull into code.
If you like data stories, trend analysis, macroeconomic context — or just want some data to play with — FRED is an ideal resource.


Leave a comment